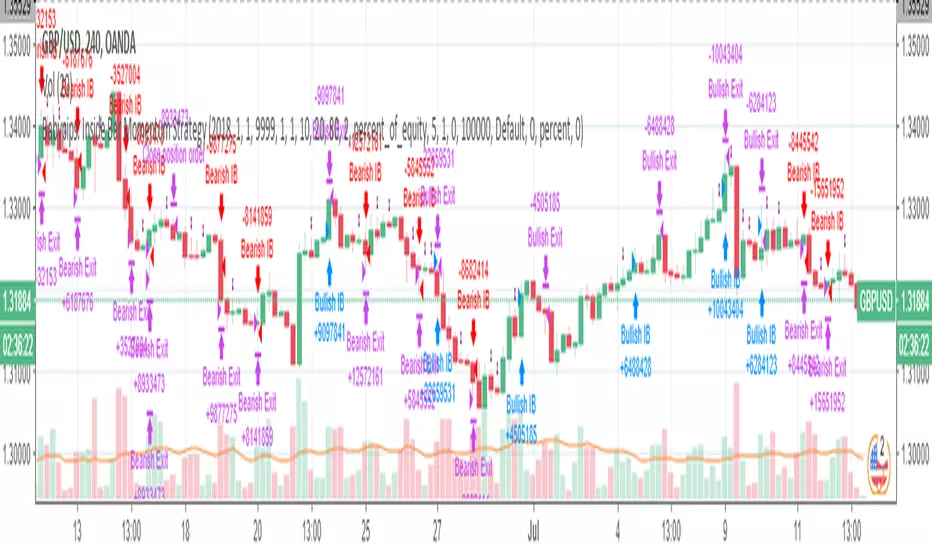
Babypips: Inside Bar Momentum StrategyThe strategy contained in this post comes courtesy of babypips (.com), an excellent resource for all thing forex related. If you are new to trading, the site is definitely worth checking out!
Code commentary and an introduction to Inside Bars are available for this post on the Backtest-Rookies (.com) website.
Note: If you are interested in custom development services, please check out our services page on the Backtest-Rookies site.
Strategy Overview
Inside Bar Momentum Strategy.
Inside Bar Detection
Position sizing based on stoploss distance ( Note: Based on equity and assumes that the account currency is the counter currency.
Stop buys for entries
Takeprofit / Stoplosses for exits
Control Stopbuy, Takeprofit and Stoploss targets with inputs
Control Backtest start/end dates
"the strat" için komut dosyalarını ara
The Strat Candle Labels & Color Inc F2D F2UThis script uses TheStrat candle numbers 1, 2D, 2U, 3 and places the text below or above. I have also now added the Failed 2D/2U labels. You can also change the text size. This also allows you to change the colors of the candles with two options for the 1 & 3 so you can color them in the direction they are going. For example a 1 that is green can be green and a 1 that is red can be red.

The Strat: 3-2D Setup Label + Entry, Target & AlertsThis is an indicator that identifies the 3-2D setup based on TheStrat & will alert you if you have this on the chart. Once the 3-2D setup happens this will give you the entry, target and price labels. You can change the font size, label colors and add optional alerts.

The Strat Candle Types (1 / 2U / 2D / 3)This script uses TheStrat candle numbers 1, 2D, 2U, 3 and places the text below or above. You can also change the text size. This also allows you to change the colors of the candles with two options for the 1 & 3 so you can color them in the direction they are going. For example a 1 that is green can be green and a 1 that is red can be red.

Keltner Channels Strategy NewThe strategy is chenging the same as an original copy, but this one is for tests, so I will publish it and check results

MTF EMA Hariss 369The strategy has been prepared in a simplistic manner and easy to understand the concept by any novice trader.
Indicators used:
Current Time frame 20 EMA- Gives clear look about current time frame dynamic support and resistance and trend as well.
Higher Time Frame 20 EMA: Gives macro level trend, support and resistance
Kama: Capture volatility and trend direction.
RVOL: Main factor of price movement.
Buy when price closes above current time frame 20 ema and current time frame 20 ema is above higher time frame 20 ema. Stop loss just below the low of last candle. One can use current time frame 20 ema, higher time frame 20 ema or kama as stop loss depending upon type of asset class and risk appetite. The ideal way is to keep 20 ema as trailing sl if one wants to trail with trend.
Sell when price closes below current time frame 20 ema and current time frame 20 ema is lower than higher time frame 20 ema. Stop loss just above high of last candle.
Ideal target is 1.5 or 2 times of stop loss.
Entry and exit time depends on trading style. Eg. if you want to enter and exit in 5 min time frame, then choose 15 min or 1h as higher time frame as trend filter. Buy and sell signals are also plotted based on this strategy. One should always go with the higher time frame trend. Opting higher time frame trend filter always filters out market noises.

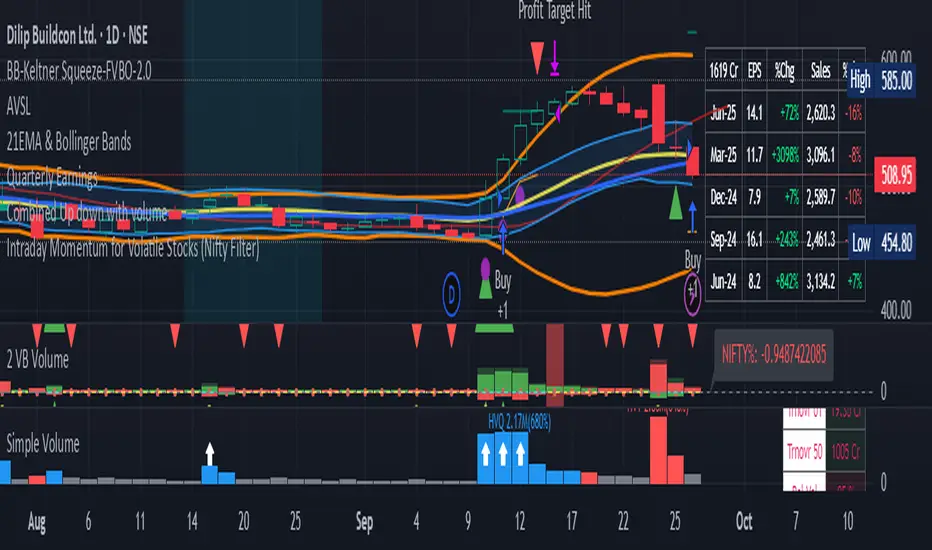
Intraday Momentum for Volatile Stocks 29.09The strategy targets intraday momentum breakouts in volatile stocks when the broader market (Nifty) is in an uptrend. It enters long positions when stocks move significantly above their daily opening price with sufficient volume confirmation, then manages the trade using dynamic ATR-based stops and profit targets.
Entry Conditions
Price Momentum Filter: The stock must move at least 2.5% above its daily opening price, indicating strong bullish momentum. This percentage threshold is customizable and targets gap-up scenarios or strong intraday breakouts.
Volume Confirmation: Daily cumulative volume must exceed the 20-day average volume, ensuring institutional participation and genuine momentum. This prevents false breakouts on low volume.
Market Regime Filter: The Nifty index must be trading above its 50-day SMA, indicating a favorable market environment for momentum trades. This macro filter helps avoid trades during bearish market conditions.
Money Flow Index: MFI must be above 50, confirming buying pressure and positive money flow into the stock. This adds another layer of momentum confirmation.
Time Restriction: Trades are only initiated before 3:00 PM to ensure sufficient time for position management and avoid end-of-day volatility.
Exit Management
ATR Trailing Stop Loss: Uses a 3x ATR multiplier for dynamic stop-loss placement that trails higher highs, protecting profits while giving trades room to breathe. The trailing mechanism locks in gains as the stock moves favorably.
Profit Target: Set at 4x ATR above the entry price, providing a favorable risk-reward ratio based on the stock's volatility characteristics. This adaptive approach adjusts targets based on individual stock behavior.
Position Reset: Both stops and targets reset when not in a position, ensuring fresh calculations for each new trade.
Key Strengths
Volatility Adaptation: The ATR-based approach automatically adjusts risk parameters to match current market volatility levels. Higher volatility stocks get wider stops, while calmer stocks get tighter management.
Multi-Timeframe Filtering: Combines intraday price action with daily volume patterns and market regime analysis for robust signal generation.
Risk Management Focus: The strategy prioritizes capital preservation through systematic stop-loss placement and position sizing considerations.
Considerations for NSE Trading
This strategy appears well-suited for NSE intraday momentum trading, particularly for mid-cap and small-cap stocks that exhibit high volatility. The Nifty filter helps align trades with broader market sentiment, which is crucial in the Indian market context where sectoral and index movements strongly influence individual stocks.
The 2.5% threshold above open price is appropriate for volatile NSE stocks, though traders might consider adjusting this parameter based on the specific stocks being traded. The strategy's emphasis on volume confirmation is particularly valuable in the NSE environment where retail participation can create misleading price movements without institutional backin
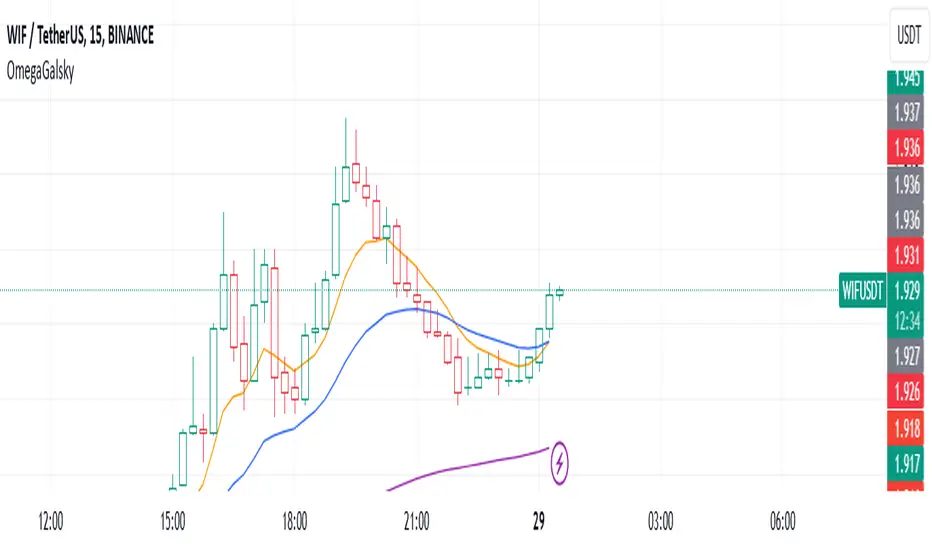
Omega_galskyThe strategy uses three Exponential Moving Averages (EMAs) — EMA8, EMA21, and EMA89 — to decide when to open buy or sell trades. It also includes a mechanism to move the Stop Loss (SL) to the Break-Even (BE) point, which is the entry price, once the price reaches a Risk-to-Reward (R2R) ratio of 1:1.
Key Steps:
Calculating EMAs: The script computes the EMA values for the specified periods. These help identify market trends and potential entry points.
Buy Conditions:
EMA8 crosses above EMA21.
The candle that causes the crossover is green (closing price is higher than the opening price).
The closing price is above EMA89.
If all conditions are met, a buy order is executed.
Sell Conditions:
EMA8 crosses below EMA21.
The candle that causes the crossover is red (closing price is lower than the opening price).
The closing price is below EMA89.
If all conditions are met, a sell order is executed.
Stop Loss and Take Profit:
Initial Stop Loss and Take Profit levels are calculated based on the entry price and a percentage defined by the user.
These levels help protect against large losses and lock in profits.
Break-Even Logic:
When the price moves favorably to reach a 1:1 R2R ratio:
For a buy trade, the Stop Loss is moved to the entry price if the price increases sufficiently.
For a sell trade, the Stop Loss is moved to the entry price if the price decreases sufficiently.
This ensures the trade is risk-free after the price reaches the predefined level.
Visual Representation:
The EMAs are plotted on the chart for easy visualization of trends and crossovers.
Entry and exit points are also marked on the chart to track trades.
Purpose:
The strategy is designed to capitalize on EMA crossovers while minimizing risks using Break-Even logic and predefined Stop Loss/Take Profit levels. It automates decision-making for trend-following traders and ensures disciplined risk management.
McClellan A-D Volume Integration ModelThe strategy integrates the McClellan A-D Oscillator with an adjustment based on the Advance/Decline (A-D) volume data. The McClellan Oscillator is calculated by taking the difference between the short-term and long-term exponential moving averages (EMAs) of the A-D line. This strategy introduces an enhancement where the A-D volume (the difference between the advancing and declining volume) is factored in to adjust the oscillator value.
Inputs:
• ema_short_length: The length for the short-term EMA of the A-D line.
• ema_long_length: The length for the long-term EMA of the A-D line.
• osc_threshold_long: The threshold below which the oscillator must drop for an entry signal to trigger.
• exit_periods: The number of periods after which the position is closed.
• Data Sources:
• ad_advance and ad_decline are the data sources for advancing and declining issues, respectively.
• vol_advance and vol_decline are the volume data for the advancing and declining issues. If volume data is unavailable, it defaults to na (Not Available), and the fallback logic ensures that the strategy continues to function.
McClellan Oscillator with Volume Adjustment:
• The A-D line is calculated by subtracting the declining issues from the advancing issues. Then, the volume difference is applied to this line, creating a “weighted” A-D line.
• The short and long EMAs are calculated for the weighted A-D line to generate the McClellan Oscillator.
Entry Condition:
• The strategy looks for a reversal signal, where the oscillator falls below the threshold and then rises above it again. The condition is designed to trigger a long position when this reversal happens.
Exit Condition:
• The position is closed after a set number of periods (exit_periods) have passed since the entry.
Plotting:
• The McClellan Oscillator and the threshold are plotted on the chart for visual reference.
• Entry and exit signals are highlighted with background colors to make the signals more visible.
Scientific Background:
The McClellan A-D Oscillator is a popular market breadth indicator developed by Sherman and Marian McClellan. It is used to gauge the underlying strength of a market by analyzing the difference between the number of advancing and declining stocks. The oscillator is typically calculated using exponential moving averages (EMAs) of the A-D line, with the idea being that crossovers of these EMAs indicate potential changes in the market’s direction.
The integration of A-D volume into this model adds another layer of analysis, as volume is often considered a leading indicator of price movement. By factoring in volume, the strategy becomes more sensitive to not just the number of advancing or declining stocks but also how significant those movements are based on trading volume, as discussed in Schwager, J. D. (1999). Technical Analysis of the Financial Markets. This enhanced version aims to capture stronger and more sustainable trends in the market, helping to filter out false signals.
Additionally, volume analysis is often used to confirm price movements, as described in Wyckoff, R. (1931). The Day Trading System. Therefore, incorporating the volume of advancing and declining stocks in the McClellan Oscillator offers a more robust signal for trading decisions.

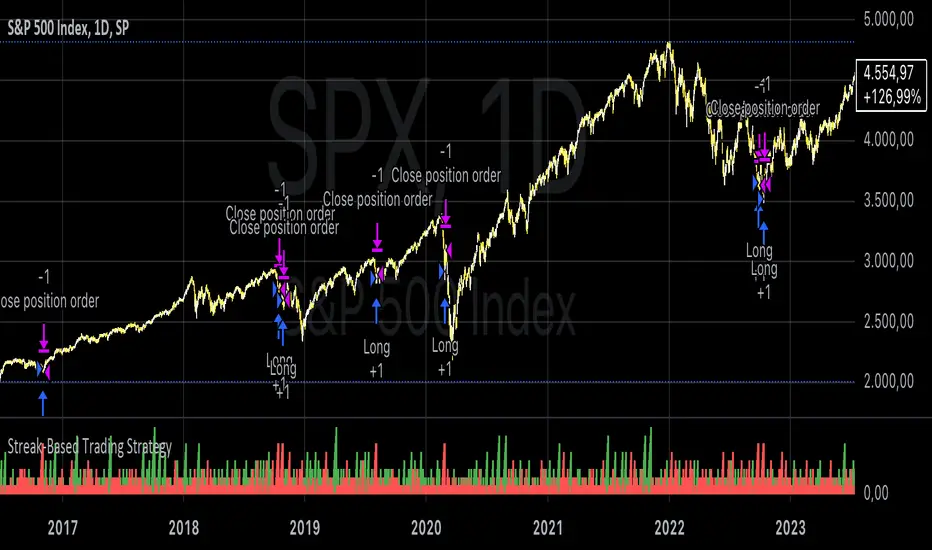
Streak-Based Trading StrategyThe strategy outlined in the provided script is a streak-based trading strategy that focuses on analyzing winning and losing streaks. It’s important to emphasize that this strategy is not intended for actual trading but rather for statistical analysis of streak series.
How the Strategy Works
1. Parameter Definition:
• Trade Direction: Users can choose between “Long” (buy) and “Short” (sell).
• Streak Threshold: Defines how many consecutive wins or losses are needed to trigger a trade.
• Hold Duration: Specifies how many periods the position will be held.
• Doji Threshold: Determines the sensitivity for Doji candles, which indicate market uncertainty.
2. Streak Calculation:
• The script identifies Doji candles and counts winning and losing streaks based on the closing price compared to the previous closing price.
• Streak counting occurs only when no position is currently held.
3. Trade Conditions:
• If the loss streak reaches the defined threshold and the trade direction is “Long,” a buy position is opened.
• If the win streak is met and the trade direction is “Short,” a sell position is opened.
• The position is held for the specified duration.
4. Visualization:
• Winning and losing streaks are plotted as histograms to facilitate analysis.
Scientific Basis
The concept of analyzing streaks in financial markets is well-documented in behavioral economics and finance. Studies have shown that markets often exhibit momentum and trend-following behavior, meaning the likelihood of consecutive winning or losing periods can be higher than what random statistics would suggest (see, for example, “The Behavior of Stock-Market Prices” by Eugene Fama).
Additionally, empirical research indicates that investors often make decisions based on psychological factors influenced by streaks. This can lead to irrational behavior, as they may focus on past wins or losses (see “Behavioral Finance: Psychology, Decision-Making, and Markets” by R. M. F. F. Thaler).
Overall, this strategy serves as a tool for statistical analysis of streak series, providing deeper insights into market behavior and trends rather than being directly used for trading decisions.
HMA Crossover 1H with RSI, Stochastic RSI, and Trailing StopThe strategy script provided is a trading algorithm designed to help traders make informed buy and sell decisions based on certain technical indicators. Here’s a breakdown of what each part of the script does and how the strategy works:
Key Components:
Hull Moving Averages (HMA):
HMA 5: This is a Hull Moving Average calculated over 5 periods. HMAs are used to smooth out price data and identify trends more quickly than traditional moving averages.
HMA 20: This is another HMA but calculated over 20 periods, providing a broader view of the trend.
Relative Strength Index (RSI):
RSI 14: This is a momentum oscillator that measures the speed and change of price movements over a 14-period timeframe. It helps identify overbought or oversold conditions in the market.
Stochastic RSI:
%K: This is the main line of the Stochastic RSI, which combines the RSI and the Stochastic Oscillator to provide a more sensitive measure of overbought and oversold conditions. It is smoothed with a 3-period simple moving average.
Trading Signals:
Buy Signal:
Generated when the 5-period HMA crosses above the 20-period HMA, indicating a potential upward trend.
Additionally, the RSI must be below 45, suggesting that the market is not overbought.
The Stochastic RSI %K must also be below 39, confirming the oversold condition.
Sell Signal:
Generated when the 5-period HMA crosses below the 20-period HMA, indicating a potential downward trend.
The RSI must be above 60, suggesting that the market is not oversold.
The Stochastic RSI %K must also be above 63, confirming the overbought condition.
Trailing Stop Loss:
This feature helps protect profits by automatically selling the position if the price moves against the trade by 5%.
For sell positions, an additional trailing stop of 100 points is included.

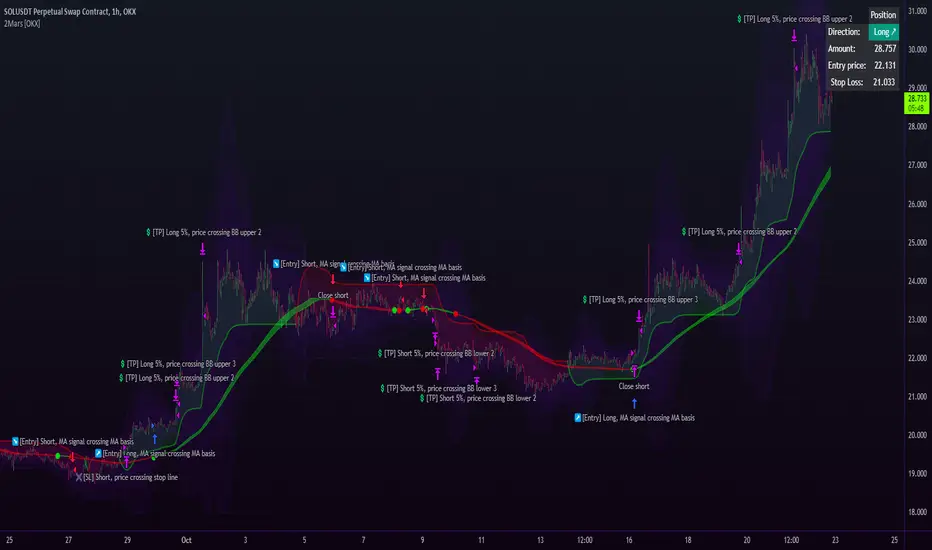
2Mars strategy [OKX]The strategy is based on the intersection of two moving averages, which requires adjusting the parameters (ratio and multiplier) for the moving average.
Basis MA length: multiplier * ratio
Signal MA length: multiplier
The SuperTrend indicator is used for additional confirmation of entry into a position.
Bollinger Bands and position reversal are used for take-profit.
About stop loss:
If activated, the stop loss price will be updated on every entry.
Basic setup:
Additional:
Alerts for OKX:
Buy Only Strategy with Dynamic Re-Entry and ExitThe strategy aims to create a simple buy-only trading system based on moving average crossovers and the Weekly Commodity Channel Index (CCI) or Weekly Average Directional Index (ADX). It generates buy signals when the fast-moving average crosses above the slow-moving average and when the Weekly CCI and or Weekly ADX meet the specified conditions.
The strategy also allows for dynamic re-entry, which means it can open new long positions if the price goes above the three moving averages after an exit. However, the strategy will exit the long position if the price closes below the third moving average.
ENTRY CONDITIONS
The script defines the conditions for generating buy signals. It checks for two conditions for a valid buy signal:
• If the fast-moving average crosses above the slow-moving average -THERE IS Dynamic Re-Entry also
• If the user chooses HE OR SHE CAN FILTER TRADES BY USING CCI OR ADX
Dynamic Re-Entry:
the script allows for dynamic re-entry. If there is no active long position and the price is above all three moving averages a new long position is opened.
Exit Conditions
The script defines the exit condition for closing a long position. If the price closes below the third moving average, the script closes the long position.
IMPORTANT NOTICE
ONLY DAILY TIME FRAME
THERE WOULD BE WHIPSAW USE YOUR OWN ACCUMEN TO MINIMISE THEM
ITS ONLY BUY STRATEGY
EXIT CAN BE STRATEGY BASED OR SET PROFIT AND TARGETS AS PER RISK APETITE /RISK MANAGEMENT
DONT TRADE OPTIONS ON THIS
SUITABLE FOR STOCKS OF USA AND INDIAN MARKETS
ALWAYS REMEMBER TO DO YOUR OWN RESEARCH BEFORE TRADING AND INVESTING

Bullish and Bearish Candlestick Patterns StrategyThe strategy is a combination of candlestick pattern analysis and Fibonacci retracement levels to identify potential buy and sell signals in the market. Here's how the strategy works and how you can trade accordingly:
Candlestick Pattern Analysis:
The strategy looks for specific bullish and bearish candlestick patterns to identify potential trend reversals or continuations. The bullish patterns include:
Bullish Engulfing: This pattern occurs when a bullish candle fully engulfs the previous bearish candle.
Hammer: It is a single candlestick pattern with a small body and a long lower wick, indicating a potential bullish reversal.
Morning Star: This pattern consists of three candles, with the middle one being a small-bodied candle that gaps down and the other two being bullish candles.
The bearish patterns include:
Bearish Engulfing: Similar to the bullish engulfing, but this time, a bearish candle fully engulfs the previous bullish candle.
Shooting Star: A single candlestick pattern with a small body and a long upper wick, suggesting a potential bearish reversal.
Evening Star: This pattern is the opposite of the morning star, with a small-bodied candle that gaps up between two bearish candles.
Fibonacci Retracement Levels:
The strategy uses Fibonacci retracement levels to determine potential support and resistance levels in the market. The main level considered in this strategy is the Fibonacci 0.5 level, which is the midpoint of the previous swing move.
Trading Accordingly:
To trade using this strategy, follow these steps:
a. Observe the Chart: Apply the indicator to your preferred chart, and observe the candlestick patterns and the plotted support, resistance, and Fibonacci 0.5 levels.
b. Buy Signal: A buy signal is generated when any of the bullish candlestick patterns (Bullish Engulfing, Hammer, Morning Star) occur, and the low price of the current candle is above or equal to the Fibonacci 0.5 level. This suggests a potential bullish reversal or continuation of an existing uptrend.
c. Sell Signal: A sell signal is generated when any of the bearish candlestick patterns (Bearish Engulfing, Shooting Star, Evening Star) occur, and the high price of the current candle is below or equal to the Fibonacci 0.5 level. This indicates a potential bearish reversal or continuation of an existing downtrend.
d. Risk Management: Place stop-loss orders to protect your position in case the market moves against your trade. Consider setting the stop-loss below the recent swing low for buy trades and above the recent swing high for sell trades.
e. Take Profit: Set a target for taking profits based on your risk-reward ratio. You can use the recent swing high for buy trades as a potential target and the recent swing low for sell trades.
f. Filter Signals: Keep in mind that not all signals will result in profitable trades. It's essential to filter signals with other technical analysis tools and consider the overall market context.
Remember that no trading strategy guarantees profits, and trading always carries inherent risks. It's crucial to practice proper risk management, use appropriate position sizing, and test the strategy thoroughly in a demo environment before applying it to live trading. Additionally, consider combining this strategy with other indicators or analysis methods to make more informed .

DJ Soori Trading StrategyThe strategy combines three indicators: Exponential Moving Average (EMA), Weighted Moving Average (WMA), and Average Directional Index (ADX).
The EMA and WMA are used to track the average price over different time periods.
The ADX measures the strength of a trend in the market.
The strategy generates buy signals when the EMA is higher than the WMA and the ADX is above a certain threshold. It suggests a potential uptrend.
It generates sell signals when the EMA is lower than the WMA and the ADX is above the threshold. It suggests a potential downtrend.
The strategy also considers whether the ADX is rising or falling to indicate the strength of the trend.
The EMA, WMA, and ADX values are plotted on the chart.
Buy and sell signals are shown as labels on the chart, indicating "Buy (Strong)" or "Buy (Weak)" for buy signals, and "Sell (Strong)" or "Sell (Weak)" for sell signals.

Stochastic RSI Strategy (with SMA and VWAP Filters)The strategy is designed to trade on the Stochastic RSI indicator crossover signals.
Below are all of the trading conditions:
-When the Stochastic RSI crosses above 30, a long position is entered.
-When the Stochastic RSI crosses below 70, a short position is entered.
-The strategy also includes two additional conditions for entry:
-Long entries must have a positive spread value between the 9 period simple moving average and the 21 period simple moving average.
-Short entries must have a negative spread value between the 9 period simple moving average and the 21 period simple moving average.
-Long entries must also be below the volume-weighted average price.
-Short entries must also be above the volume-weighted average price.
-The strategy includes stop loss and take profit orders for risk management:
-A stop loss of 20 ticks is placed for both long and short trades.
-A take profit of 25 ticks is placed for both long and short trades.

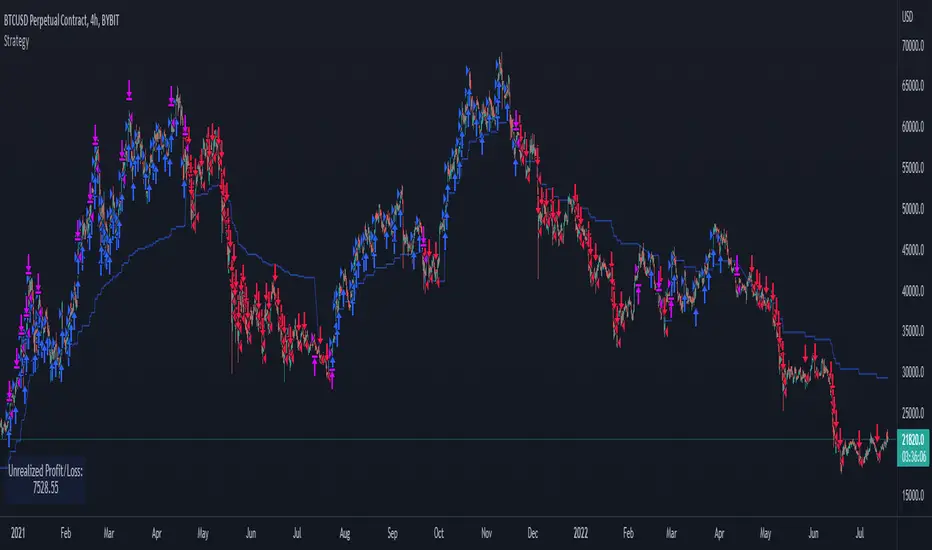
AlphaTrend StrategyThe strategy version of AlphaTrend indicator for backtesting and optimisation purposes for TradingView users:
Screener / Explorer version and an English explantion video will be published soon...
AlphaTrend's parameters are designed for daily and 4H charts, feel free to optimize on all time frames.
Hope you all use Alphatrend in your profitable trades.
Kıvanç

Pinbar trailing stop strategyThe strategy finds the nearest pinbar pattern and opens a position (long or short). You choose your take profit and stop loss multiplier.
Take Profit - X times the pinbar size from it's highest point.
Stop loss - X times the pinbar size from it's lowest point.
You can find more detailed screenshots and the source-code on my github page: samgozman/pinbar-strategy-tradingview

Long TermThe Strategy is to buy based on Stan which is long term strategy on stocks. This works on 30WEEK And RSI indicator which helps to understand when to enter stock and when not to.
Additionally due to fast moving trades, added logic of crossover of close price above 50DMA

CPR Strategy - (Call and Put Option Selling)The strategy is designed using CPR and Donchian Channels.
STRATEGY RULES:
We need to wait for "Sell Call" or "Sell Put" arrow on the chart.
Sell call or put on the next candle.
Sell call strike above CPR resistance and candle close above it will be stop loss.
Similarly, sell put strike below CPR support and candle close below it will be stop loss.
This strategy is purely based on theta decay principle.
Hence, always use this strategy on weekly option.
Also, never trade on Monday or Friday to avoid volatility.
Hope you enjoy this strategy and become a professional trader.
Enjoy! :-)
Drop your message below if you have any doubts. Thanks.

Momentum Trading Strategy (Weekly Chart)The strategy will open position when there is momentum in the stock
The strategy will ride up your stop loss based on the super trend.
The strategy will close your operation when the market price crossed the stop loss.
The strategy will close operation when the line based on the volatility will crossed

The Strategy - Ichimoku Kinko Hyo and moreThe purpose of this strategy is to make the signals from my scripts available for verification by backtests. Different signal and filter combinations can be created and specific manual parameter optimization can be carried out.
In detail, this strategy includes:
23 entry signals
two entry filters with each 9 filters
two exit filters with each 9 filters
take profit and stop loss
time period for backtesting
Buy The Dips - MA200 OptimisedThe strategy combines a contrarian approach (buying the dips) with a trend-following logic (only when the price is above the MA200)
The strategy seeks to find the best times when buying the dips on the asset should result to be more profitable.
The price above a long-term moving average indicates momentum that increases the possibility of profiting from buying the asset on short-term weakness.
